The problem
I wanted a budget tracker that was quick to update, readable at a glance, and available from any device without maintaining a backend.
What I built
- Built the interface in React with Firebase for authentication and cloud persistence.
- Supported email, Google, and demo sign-in paths so the app could be tried without creating an account.
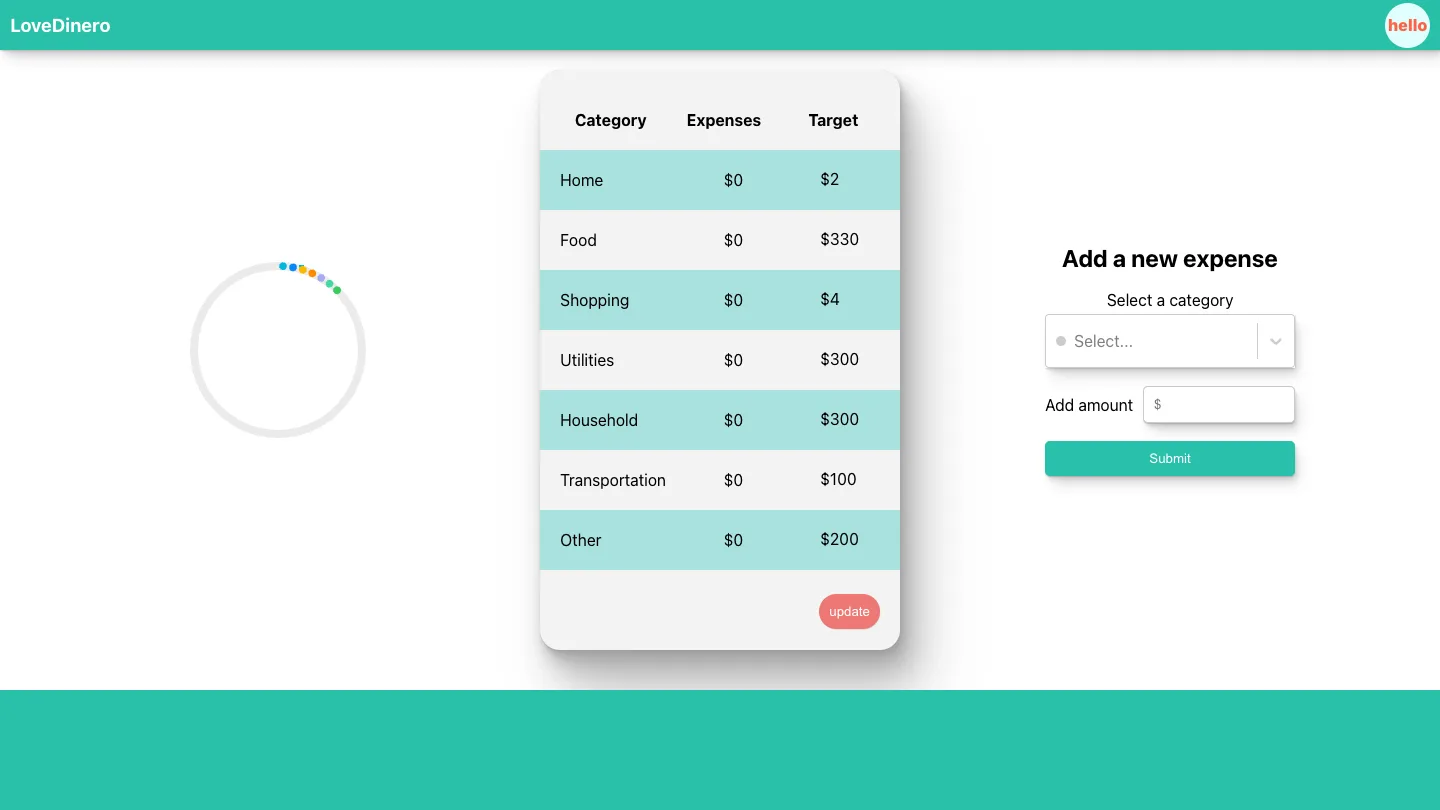
- Modeled seven expense categories, each with a spending target and running total.
- Used D3 to show the balance between categories without turning the dashboard into a reporting tool.
What changed
- A live expense tracker with cloud-synced data.
- Three sign-in paths, including a demo account for quick evaluation.
- A single dashboard for category totals, targets, and new expenses.
What I learned
The chart was the easy part. The real work was keeping the add-expense flow short and making the empty and demo states understandable.
Back to all projects